Interferometers – (second part)
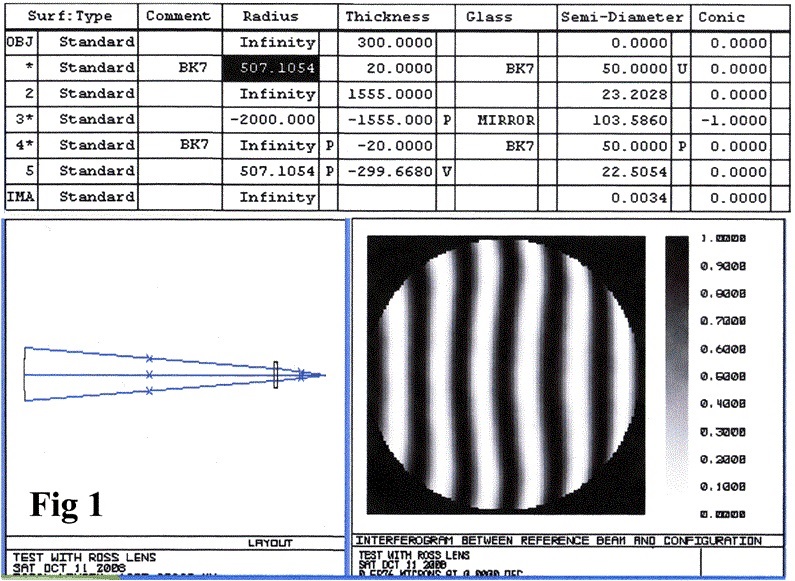
In this example shown (Fig 1), the mirror is a 200mm diameter F/5 parabolic mirror with a Ross lens tested at the centre of curvature. The basic optical layout of the mirror with Ross lens and focus position is shown at bottom left with the “Prescription” for the optical system above it.
We arbitrarily placed the Ross lens 300mm in front of the interferometer on the optical axis (Z axis) and then optimised the Ross lens radii until it achieved a value better than 1/20λ PV. The result is the picture at bottom right in Fig 1.
Once the system was set up and optimised, we deliberately moved the Ross lens 3 mm along the axis.
A small shift of the interferometer position was then needed to allow the out going and return beams to coincide in the interferometer. The result is Fig 2 adjacent.
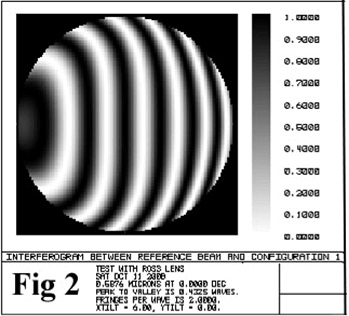
This suggested a error a little worse than 1/3λ. Just to make this clear – This means if an Interferometer was used to test a perfect mirror with the Ross lens 3mm out of position along the axis, it would appear that the mirror had a PV of 1/3λ when it was in fact a perfect mirror!
1mm movement would suggest the mirror was about PV 1/10λ out.
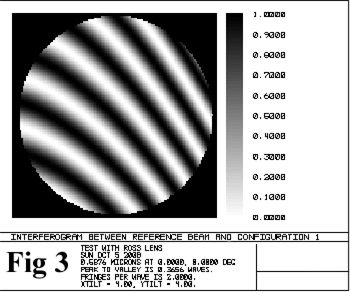
We then moved the Ross lens back to its correct position at 300mm along the axis and then shifted it off the optical axis (Y axis) by 3mm.
The result is Fig 3 adjacent
This position gives 1 1/2 fringes of astigmatism,
So a mirror tested at these settings would appear to be PV 1.5λ out which is a massive amount in an astronomical mirror!
Scaling that back to get an accuracy of 1/10λ requires the Ross lens to be positioned within 0.2mm of the optical axis of the system.
We would find it very informative if an interferometer tester can explain how he positions the Ross lens on the optical axis to the accuracy needed – And then how he determines where along the optical axis to position it. But if he cannot position the lens accurately, he cannot obtain accurate results from the interferometer testing.
This example is just about positioning the single Ross lens in relation to the mirror. We have not considered the alignment to the body of the interferometer or the placement of the extra lens used to convert from a flat to a spherical Wavefront. If one lens and mirror cannot be positioned properly, then how can the other optical items be correctly aligned?
We know of yet another method being used: the Ross correction lens can be left out and the fringes created from the spherical aberration can be used instead of tilting the reference flat. Although we are aware that this method has been used on some mirrors, a 20″ F/4 would show about 54 fringes from spherical, and straightaway it is difficult to see how accuracies within a typical RMS of 1/35λ could ever be achieved.
You are be asking the interferometer plus all the lenses in the set-up to have a total accuracy to better than 1/10 of a percent! The computer has the job of subtracting the fringes seen in this set-up from what a perfect mirror would give and use any remainder to calculate the error on the mirror surface or Wavefront. This will only leave extremely subtle shades of grey to calculate error from. Spherical aberration produces circular fringes and they are not regularly spaced: there will be a big gap in the centre of the mirror and the fringes would crowd together towards the edge of the mirror. This will give poor accuracy in the centre within the first fringe. There will also be accuracy issues at the edge due to the fringes being extremely close together.

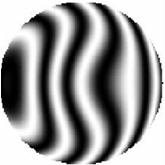
The picture adjacent is of the idealised fringes from a 6″ F/8 generated by computer. If you look carefully at the inner black fringe in this picture, you will note a well defined outer edge with a sharp transition between black and white, – but the inner edge of the fringe is less distinct with more and longer shades of grey.
This would indicate that the real optical centre of the fringe may be nearer its outer edge than in the physical centre of the black band, where you may be tempted to place it. So where is the exact optical centre of this fringe? There are no fringes in the centre of this picture, so the computer may try to work solely with the level of grey. If the light source does not produce even illumination across the width of the picture or the CCD response is not perfect, the Interferometer results will suggest there is a bump in the centre of the mirror.ù
To counter this, the mirror, or the internal reference in the Interferometer, can be tipped slightly off axis again. The picture adjacent is the idealised computer generated fringes from the 6″ F/8 tipped 2.5 waves, (5 fringes), and set at “best fit”.
This does give some fringes across the centre of the mirror but they are now curved and of variable width instead of straight. Now that they are curved and with different densities of grey each side, It is again difficult to work out where the centre of the fringes are.
Another thing that intrigues us about Interferometer testing is we often see test results suggesting a mirror has astigmatism, – but it does not appear that the very simple test for astigmatism using an eyepiece is carried out to confirm the astigmatism exists. Astigmatism is very rare in a professionally made mirror. If this simple test confirmed that no astigmatism exists, then any results from an interferometer suggesting otherwise are wrong and probably due to an incorrect set-up.
We believe this simple test for astigmatism is crucial. We believe a mirror should always be proved free of astigmatism before any other bench testing is carried out. This test is always carried out on our mirrors before they go for the Double Pass Null. Then we have confidence there is no astigmatism in the mirror. We believe this simple test should also be applied before testing with an interferometer.
The strengths of Interferometer Testing are:-
- Able to sample tens or hundreds of points on the mirror and calculate RMS & Strehl ratio quickly.
- Results can be highly customised. It can produce highly impressive reports containing pictures, graphs, 3D pictograms and tables of figures.
The attractive reports inspire confidence in the testing and imply it has an impressive accuracy.
(We don’t agree about the impressive accuracy of course!)
If you are considering an independent Interferometer test, you may wish to clarify the following details first:-
- The Model of Interferometer to be used
- Confirm the method [Fringe Analysis?] [Double Pass Optics?]
- A full diagram of the optical path used for the tests
- Details of any additional optics used; Including Lens details; F/ ratios; focal lengths; Distances & Spacing
- Method of setting up and use of the equipment
- Any ancillary equipment or programmes used to process and produce the results.
If you have problems obtaining these basic details, then you might choose to look elsewhere to get your mirror tested? You might also ask for the test on your mirror to be done twice – Repeated – with the mirror rotated through 90 degrees.
“Dead-Give-Aways” Interferometer set-up problems.
If you do get an interferometer test done, there are some things you can look for in the interferometer report that indicate it was not performed adequately. All below are examples seen in Interferometer test reports.
The first thing is do the results look central? In the example adjacent we suggest its very obvious something is off-centre.
Taken by itself, this particular example would not have affected the main interferometer test results as they could have been derived from another set-up, – but it should perhaps be worrying to you that if this one is off-centre, then the other tests might have been.
Much more serious is obvious coma in the interferometer results. The test report you receive will usually have a picture of the wave-front as seen by the interferometer. An example is the picture showing green fringes adjacent.
If you see “S” bending in the fringes, (like in this example), the report probably wont explain this is coma due to errors in the interferometer set-up. One or more of the optical elements involved was not quite on axis or was at a small angle to the axis.
The tester is expecting the interferometer software to note the errors in the set-up and subtract them from the final result. For this test we show the final result adjacent to the fringes. If you consider the surface underneath the black line superimposed, the shape of the mirror under the line is again an “S” curve. This is still showing coma and is strong evidence the interferometer software had not correctly isolated and subtracted the errors in the set-up.
How are we sure its errors in the set-up and not in the mirror? – That’s dead easy – we can’t make mirrors with shapes like this!
The process of grinding, polishing and figuring a mirror is basically rotary and is symmetrical. Astigmatism is removed by the mirror maker in the early part of the process. Therefore any errors in the mirror will nearly always be symmetrical. Either not quite the correct curve on the mirror or perhaps some circular zones.
ERR – No zones on our mirrors, – thank you very much!
So seeing an “S” curve on the fringes and then on the mirror profile is a “Dead-Give-away” that the interferometer set-up was incorrect and the software was unable to process the results correctly. We have just mentioned coma so far. there is probably also some astigmatism in the set-up plus some spherical aberration caused by an incorrect distance between the various optical elements. then there is the real error on the mirror. We suggest there are too many terms for it to properly separate out the real error. This test reported the PV error on the mirror was 0.5λ.
But its certainly a pair of very nice pictures for the test report. There can be no argument it looks extremely professional – That might help convince you the test is accurate?
Now you know what to look for, – here is another example. This one is a lot better than the previous example as the Interferometer fringes are nearly straight across the majority of the mirror.
But look at the top and bottom of the fringes. At the top they giving a tell-tale bend right and at the bottom they are bending left. Its the “S” curve again! – Coma from incorrect set-up.
The matching mirror surface profile is next to the fringes and in this case the “S” curve can be made out running nearly East to West on the surface under the black line superimposed.
The error from poor set-up is still the dominant error in this test. Even with just the small bends at top and bottom of the fringes to suggest coma, it’s still impossible to derive a meaningful figure for the real error on the mirror surface. This test reported the PV error on the mirror was 0.14λ.
Certainly we can speak for ourselves, – and probably a lot of other professional mirror makers, – that any error remaining in our mirrors is predominantly symmetrical. Probably due to not quite having the correct curve. (But still within specification!) Any signs of asymmetry in Interferometer test results point to difficulties in the Interferometer set-up.
Next is a mirror test result that has the mirror looking more like a bent bottle top! Unless someone can give us a better explanation we believe its an example of where a dark fringe lies along the edge of the mirror and the interferometer software can’t interpret it accurately. In this case its happening on opposite edges at east and west.
This is mentioned as a problem earlier on this page On the edge of the mirror the interferometer may have only part of a dark fringe with no “white” (actually green in these pictures), area outside it to use as a reference when fixing the fringe centre. We believe the interferometer software cannot reliably find the centre of the fringe at these positions so introduces an error. This particular test reported the PV error on the mirror was PV 0.2λ.
Since this is virtually all due to the peaks at the east and west edges, and they are probably errors in locating the fringes, the mirror was really extremely good and certainly better than 0.1λ
We will repeat yet again that any errors remaining in a professionally made mirror ought to be symmetrical. Any sign of asymmetry in interferometer reports ought to be a “Dead-give-away” that there were problems in the Interferometer set-up or the software interpreting the fringes.
Finally
Interferometers are very good at producing impressive reports. Unfortunately that can inspire over-confidence in their results.
We suggest that Interferometers are completely fine where the accuracy required is above a wavelength. However Astronomical mirrors are large in comparison to interferometer optics and the accuracy required is a small fraction of a wavelength. In this area test results from Interferometers become highly dependant on the equipment quality and the skill of the operator. In practice there is no easy way to set-up an Interferometer test so no way of avoiding errors creeping into the set-up. Undetected errors in the set-up appear in the results as errors in the mirror under test.
Even if the set-up is perfect and the tester is absolutely superb, there is a limit on accuracy imposed by the extra optics in the Interferometer. Results will be less accurate than those obtained with a Double Pass Null.
Along with most other professional manufacturers of astronomical mirrors, we believe the most accurate method of testing a mirror remains the conventional Double Pass Null Test.
Oldham Optical